Federal science integrity investigators once concluded that the basis for lead hysteria was “difficult to explain as honest error.”
So here is a graph of the Flint, Michigan situation. a small percentage of children reportedly have elevated levels of lead in their blood. “Elevated” blood lead here is 5 micrograms per deciliter.
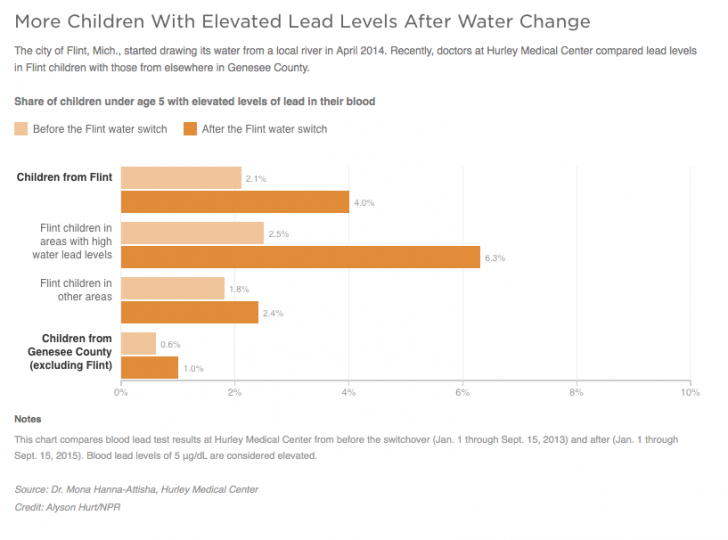
So all the hoopla is about an additional 3.8% of children having blood lead levels exceeding 5 micrograms per deciliter.
If you don’t know anything about lead, that might sound like some great tragedy. But as this CDC chart shows, it is no big deal.
So almost 90% of 1970s-era children had blood lead levels in excess of 10 micrograms per deciliter… and they all turned out fine (except as far as they were schooled by and for “progressivism”). And the blood lead levels were likely even higher for children from earlier 20th century decades — all without harm.
Lead hysteria was fueled by the junk science of the University of Pittsburgh’s Herbert Needleman. Though debunked (federal investigators concluded Needleman’s work was “difficult to explain as honest error”), it is the basis for today’s lead hysteria.
Those 1970’s era children would be in their early- to mid-40’s by now, including a large group of those in the political establishment.
The article cited in the original post as the source of the data does not report whether mean blood levels among Flint children tested for lead were higher after the water switch than before which you would think it would if they were given the tone of the article. If you read the article which is availabe on line at the American Journal of Public Heath (Feb 2016) , there is in table 2 a column titled “predicted changes in BLL pre and post water switch, ug/dL” and when you add the figures in the column for the nine wards in Flint the total is slightly negative suggesting, if anything, mean blood lead levels were lower after the water switch. The article uses a complicated geostatistical method to “predict” mean blood lead levels instead of reporting the actual mean blood lead levels. It is possible mean blood lead levels from 2013 to 2015 if the amount of lead getting into the lead of children from the contaminated water was less than the reduction in other sources of blood lead such as lead paint and lead in the soil which have been steadily declining over time.
I disagree with the assertion that “they all turned out fine”. Here is what WHO says:
There is no known safe blood lead concentration. But it is known that, as lead exposure increases, the range and severity of symptoms and effects also increases. Even blood lead concentrations as low as 5 µg/dl, once thought to be a “safe level”, may result in decreased intelligence in children, behavioural difficulties and learning problems.
Seems like a valid concern. I don’t know why the first 2% of exposed kids was OK and second 2% is a crisis.
I might be misunderstanding the graph, but this looks like a change in analytical or sampling method rather than real increase in lead concentrations due to Flint River changeover. Seems that lead concentrations have about doubled in all locales, even those outside of Flint. Again, I may be misunderstanding the data, but this seems to be the perfect controlled experiment testing timing of samples versus potential exposure to Flint River water. If so, timing, rather than Flint River exposure, is the critical factor causing increases in lead.
One wonders if the samples were of sufficient number to be scientifically valid, too. I cannot remember ever being tested for lead levels, nor can I remember my children or grandchildren being tested for the lead factor.
In my pre-teen years I had hundreds of lead soldiers. Sometimes in frustration I would chew on one and swallow the head. It has happened several time. It came back to me when I lived in the U.S. I am 78 years old, and I have high blood pressure, and type 2 diabetes. So does my brother who never plaid with lead soldiers
How about this bull from Michael Moore:
Michael MooreVerified account
@MMFlint
This is a racial killing. Flint MI is 60% black. When u knowingly poison a black city, u r committing a version of genocide #ArrestGovSnyder
I remember the cyanide scare. “Oh my God, there is cyanide in my water.” Finally the facts came out and it was no big deal. I never remember anyone dying from a cyanide overdose from drinking water.
This looks like a political ploy to remove a Republican governor from a Democratic state. The fact that he cut budgets in line with revenue really p.o.’d the Democrats.