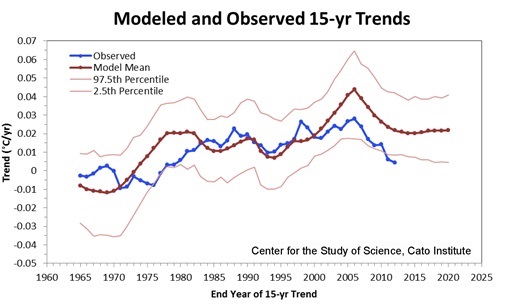
Chip Knappenberger and Pat Michaels write at Cato:
So rather than picking just one cherry that depends on the unusually warm year of 1998, how about we look at the whole tree. Below we show the results for every overlapping 15-yr period during the period 1951-2012 (i.e., starting with the period 1951-1965, 1952-1966, 1953-1967,… and ending with 1998-2012). In Figure 3, the thick red line traces the 15-yr model trend values, the thin red lines are include 95 percent of the model trend values, and the thick blue line traces the evolution of the observed 15-yr trends.

Thank you, MT Geoff, for providing the most succinct and accurate summary of this whole mess that I have ever read.
Ronald G. Havelock
Everything else about the IPCC has been shredded by analysis, yet it soldiers on. I’d hope that it would be laughed to scorn but I’m clearly wrong.
The concept of AGW was worthy of examination when it came up. It’s been examined; it has never been supported by any actual observations and it has essentially been falsified by the observations of the last 30 years. But somehow it got invested long before it was examined seriously and now that investment is proving hard to shake. I just don’t understand how it has any credibility among thinking or compassionate people.