As NOAA knows, any conclusion you want is possible when you adjust the data to suit.
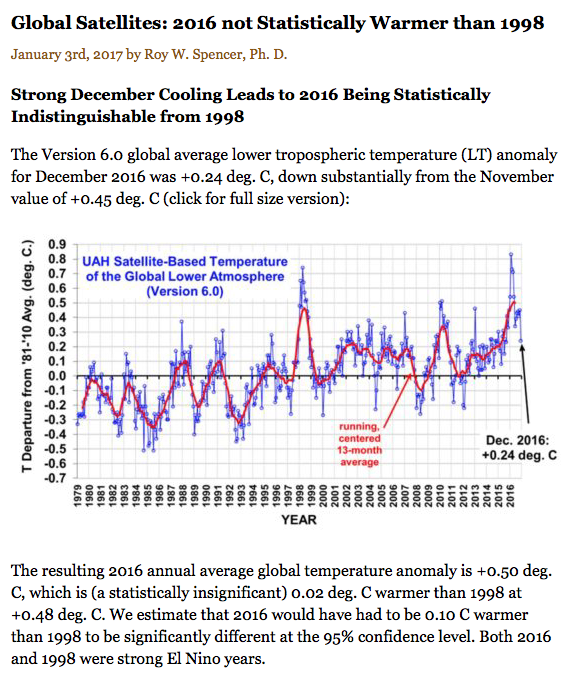
BTW, Roy Spencer just reported that 2016 was not statistically warmer than 1998, despite 10 percent more CO2.
The NOAA/Berkeley media release is below.
###
Global warming hiatus disproved — again
Study confirms steady warming of oceans for past 45 years
UNIVERSITY OF CALIFORNIA – BERKELEY
A controversial paper published two years ago that concluded there was no detectable slowdown in ocean warming over the previous 15 years – widely known as the “global warming hiatus” – has now been confirmed using independent data in research led by researchers from the University of California, Berkeley, and Berkeley Earth, a non-profit research institute focused on climate change.
The 2015 analysis showed that the modern buoys now used to measure ocean temperatures tend to report slightly cooler temperatures than older ship-based systems, even when measuring the same part of the ocean at the same time. As buoy measurements have replaced ship measurements, this had hidden some of the real-world warming.
After correcting for this “cold bias,” researchers with the National Oceanic and Atmospheric Administration concluded in the journal Science that the oceans have actually warmed 0.12 degrees Celsius (0.22 degrees Fahrenheit) per decade since 2000, nearly twice as fast as earlier estimates of 0.07 degrees Celsius per decade. This brought the rate of ocean temperature rise in line with estimates for the previous 30 years, between 1970 and 1999.
This eliminated much of the global warming hiatus, an apparent slowdown in rising surface temperatures between 1998 and 2012. Many scientists, including the International Panel on Climate Change, acknowledged the puzzling hiatus, while those dubious about global warming pointed to it as evidence that climate change is a hoax.
Climate change skeptics attacked the NOAA researchers and a House of Representatives committee subpoenaed the scientists’ emails. NOAA agreed to provide data and respond to any scientific questions but refused to comply with the subpoena, a decision supported by scientists who feared the “chilling effect” of political inquisitions.
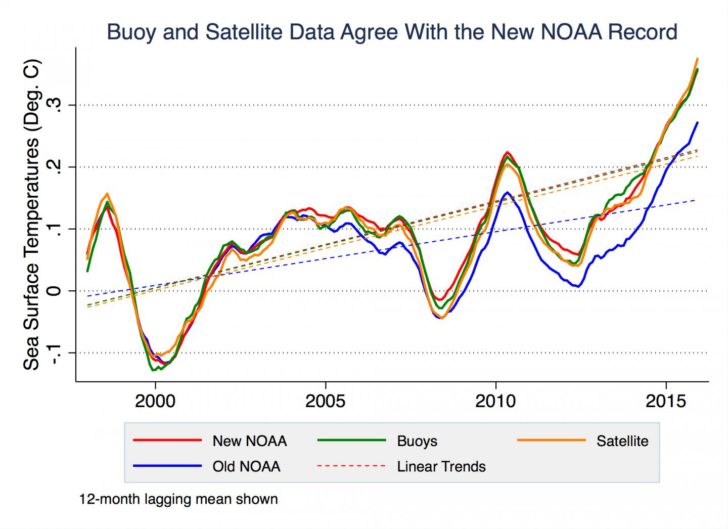
The new study, which uses independent data from satellites and robotic floats as well as buoys, concludes that the NOAA results were correct. The paper will be published Jan. 4 in the online, open-access journal Science Advances.
“Our results mean that essentially NOAA got it right, that they were not cooking the books,” said lead author Zeke Hausfather, a graduate student in UC Berkeley’s Energy and Resources Group.
Long-term climate records
Hausfather said that years ago, mariners measured the ocean temperature by scooping up a bucket of water from the ocean and sticking a thermometer in it. In the 1950s, however, ships began to automatically measure water piped through the engine room, which typically is warm. Nowadays, buoys cover much of the ocean and that data is beginning to supplant ship data. But the buoys report slightly cooler temperatures because they measure water directly from the ocean instead of after a trip through a warm engine room.
NOAA is one of three organizations that keep historical records of ocean temperatures – some going back to the 1850s – widely used by climate modelers. The agency’s paper was an attempt to accurately combine the old ship measurements and the newer buoy data.
Hausfather and colleague Kevin Cowtan of the University of York in the UK extended that study to include the newer satellite and Argo float data in addition to the buoy data.
“Only a small fraction of the ocean measurement data is being used by climate monitoring groups, and they are trying to smush together data from different instruments, which leads to a lot of judgment calls about how you weight one versus the other, and how you adjust for the transition from one to another,” Hausfather said. “So we said, ‘What if we create a temperature record just from the buoys, or just from the satellites, or just from the Argo floats, so there is no mixing and matching of instruments?'”
In each case, using data from only one instrument type – either satellites, buoys or Argo floats – the results matched those of the NOAA group, supporting the case that the oceans warmed 0.12 degrees Celsius per decade over the past two decades, nearly twice the previous estimate. In other words, the upward trend seen in the last half of the 20th century continued through the first 15 years of the 21st: there was no hiatus.
“In the grand scheme of things, the main implication of our study is on the hiatus, which many people have focused on, claiming that global warming has slowed greatly or even stopped,” Hausfather said. “Based on our analysis, a good portion of that apparent slowdown in warming was due to biases in the ship records.”
Correcting other biases in ship records
In the same publication last year, NOAA scientists also accounted for changing shipping routes and measurement techniques. Their correction – giving greater weight to buoy measurements than to ship measurements in warming calculations – is also valid, Hausfather said, and a good way to correct for this second bias, short of throwing out the ship data altogether and relying only on buoys.
Another repository of ocean temperature data, the Hadley Climatic Research Unit in the United Kingdom, corrected their data for the switch from ships to buoys, but not for this second factor, which means that the Hadley data produce a slightly lower rate of warming than do the NOAA data or the new UC Berkeley study.
“In the last seven years or so, you have buoys warming faster than ships are, independently of the ship offset, which produces a significant cool bias in the Hadley record,” Hausfather said. The new study, he said, argues that the Hadley center should introduce another correction to its data.
“People don’t get much credit for doing studies that replicate or independently validate other people’s work. But, particularly when things become so political, we feel it is really important to show that, if you look at all these other records, it seems these researchers did a good job with their corrections,” Hausfather said.
Co-author Mark Richardson of NASA’s Jet Propulsion Laboratory and the California Institute of Technology in Pasadena added, “Satellites and automated floats are completely independent witnesses of recent ocean warming, and their testimony matches the NOAA results. It looks like the NOAA researchers were right all along.”
###
Other co-authors of the paper are David C. Clarke, an independent researcher from Montreal, Canada, Peter Jacobs of George Mason University in Fairfax, Virginia, and Robert Rohde of Berkeley Earth. The research was funded by Berkeley Earth.
Ocean warming and other mass planets comes from the interior of the planet and you might notice if you drop the probe into the water to a minimum depth of 300 to 400 meters. Here you will see the actual state of temperature changes, which is why this is happening, the study of it has no idea. All those who claim that CO2 is the main cause of global warming and climate change, it seems that in their brains increased the percentage of CO2, and that they interfered with the normal respect for the laws of nature.
The relevant question to ask is under what theory of Global Warming can the oceans warm while the atmosphere doesn’t during a hiatus?
I’m with Steven. Where the heck did they get that data from? This site, among others have demonstrated that the raw satellite data show NO heating trend if you graph the data to today. So where does this (horse) hockey come from???
Whose ‘satellite’ data did they use?
The temperature scales used are arbitrary construct based on boiling water from ice to steam. The only valid scale is the Kelvin scale beginning at -273K (and even those divisions are arbitrary and related to the centigrade scale). Based on that a rise of .02C equates to a percentage rise of 0.007%. As you can see, we are doomed and frying and dying, melting as we stand here.
It is hard to take these people seriously, but I do as they have both of their grubby grasping hands in my pockets.
I was surprised that the red “satellite” line in the first graph showed so much warming. It sort-of looks like the red line merges with the orange line and climbs to 3.5 degrees. But it does not. (I copies and magnified the image and looked.) The “satellite” line ends in 2014. Shades of “hide the decline”.
I don’t understand to correct up from the buoys. The buoy is a small device collecting little solar heat. Compared with a ship which is like a heat island. The ship’s data should be corrected down.
Interesting. I dont understand how this is supposed to affect the human caused climate change debate, since that is about air temperature, not sea surface temperature. But I would like to hear input from the alarmists on why el nino is related to human generated co2.