From the GWPF: “Melting Arctic sea ice has been blamed for recent cold weather in the UK. However, Arctic sea ice has seen a huge rebound this year – to levels not seen in a decade. Something to ponder at the Met Office summit.”
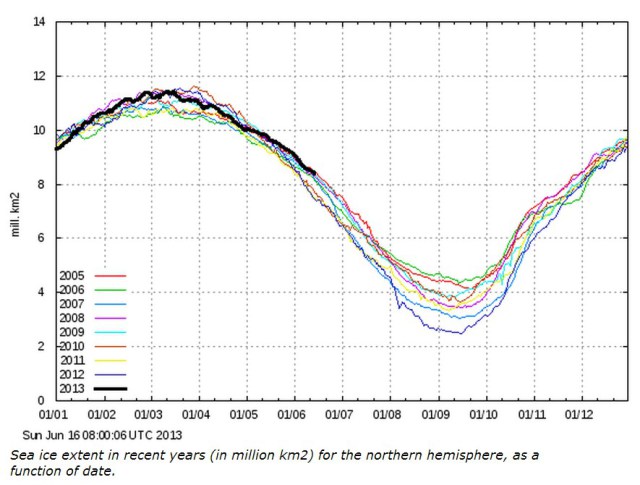
From the GWPF: “Melting Arctic sea ice has been blamed for recent cold weather in the UK. However, Arctic sea ice has seen a huge rebound this year – to levels not seen in a decade. Something to ponder at the Met Office summit.”
Kelly has rather clearly shown that the denier claims of Arctic sea ice being on the rebound are just more of the denial industry’s Big Lie tactics at work. Are they so stupid that they don’t understand the difference between thin, annual ice and thick, multi-year ice? Are they so stupid that they don’t know the difference between an instantaneous coverage area and the annualized average? Are they so stupid that they don’t know the difference between ice area and ice volume? No, they know all of these things quite well; the denier industry is counting on you to be that stupid. Don’t fall for their tricks. Don’t be useful idiots for billionaires and rent-seeking multi-national corporations. Believe the 1000’s of peer reviewed science papers, the 98% climate scientists, and the 100% of national science academies. Question the fossil fuel funded “think tanks” that hire PR firms and do no science.
As usual the Arctic meltdown carries on regardless of the predictions of “cooler” heads.
A huge swath of 1st year ice is about to disappear, disproving this cooler prediction. For several months this spring arctic ice extent was below the volume at the same time during 2012, which set a new record for sudden and massive decline in Arctic Sea Ice Volume and Extent. We have 3 months to go before Ice Minimum at the end of September.
Seasonal ice which forms over winter is a uniform thickness. It melts away at a uniform rate within the same band of latitude. We are approaching the meltdown date over a wide swath of the Arctic Ocean.
The 2012-2013 peak volume was below the record lows of the previous years, took longer to reach the peak and started to decline immediately, unlike the previous years, where the maximum volume held steady for several weeks.
The summer of 2010 was a tipping point, marked by a transtion to new lows for minimum ice volume, more than 2 standard deviations below volume decline linear trend line.
psc.apl.washington.edu/wordpress/wp-content/uploads/schweiger/ice_volume/BPIOMASIceVolumeAnomalyCurrentV2.png?%3C?php%20echo%20time%28%29%20?
nsidc.org/data/seaice_index/images/daily_images/N_daily_concentration_hires.png
nsidc.org/data/seaice_index/images/daily_images/N_stddev_timeseries.png
Let me clarify…. Showing such a minor change in ice means nothing, especially where 2012 shows the second highest amount of ice and also considerably the lowest. This is diversion science at work. Steve where did your debunking go?
Well it appears that ice is peaking off and headed back down. I’m not a big proponent for man caused global warming, but showing a fluctuation on the ice really means nothing, unless its drastic. Really you would need to show atleast 100 years to make any significant change.