If global warming is supposed to be adding moisture to the atmosphere then, oops, nature screwed up again!
In “Severe Storms Bring More ‘Weather Whiplash’ to U.S.,” warmist Abderw Freedman writes:
A weekend of violent weather left 18 people dead in Oklahoma and Arkansas from flash flooding and a string of tornadoes that ripped through the Oklahoma City metro area, which was still recovering from the devastating EF-5 twister that struck on May 20, killing 24. The extreme weather vaulted several locations into record territory for spring rainfall, after enduring two years of intense and costly drought conditions. The latest round of severe weather left much of the Central Plains and Mississippi River Valley reeling from an unusually rapid transition from drought to flooding.
The deadly El Reno, Okla., tornado that struck on May 31, killing 9 people, including 3 experienced storm chasers/researchers. The extreme swings in precipitation may be connected, in part, to climate change, since the atmosphere is now carrying more moisture than it used to due to warming air and ocean temperatures. [Emphasis added]
But meteorologist Joe Bastardi offered this graph to debunk Freedman’s highlighted assertion:
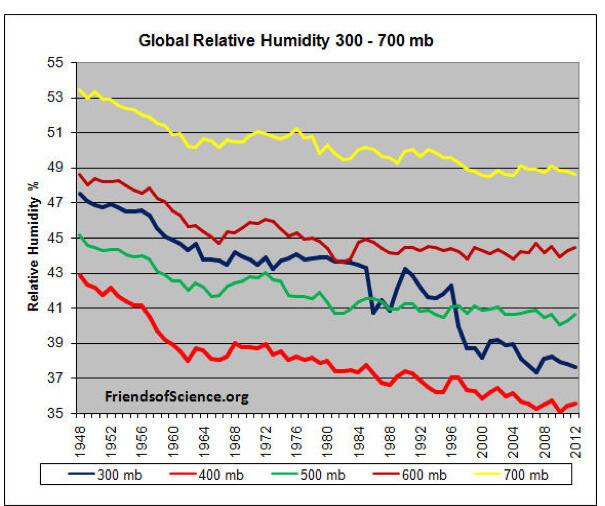
The graph is the 1,000mb data.
The pressure at the surface of the planet is 1,000 mb (by definition). Your data show the average humidity at the upper reaches of the atmosphere, not the humidity at the surface.
It certainly looks at first glance as though the climate scientists have been proven wrong – global atmospheric water vapour is going down when it should be going up along with global temperature, according to theory… but then you realise that this is just a small slice of the atmosphere, from about 3km to 12km in height, it doesn’t show water vapour in the lowest part of the atmosphere which is the most important in terms of precipitation, and it shows relative humidity rather than specific humidity, so to make the claim that there is a decline in the amount of water vapour in the atmosphere based on this data is a non sequitur. In reality, looking at specific humidity for near the surface shows a marked rise over the last few decades. Why was this not mentioned?
http://images.sodahead.com/profiles/0/0/2/0/7/6/2/8/5/tpwv-110358445704.jpeg
I appreciate your reply. I never thought for even a minute that the minuscule warming of 1 degree or so was sufficient to hide a relative humidity drop that your chart shows.
I merely thought that the persons to whom you refer might use that bit of pettifoggery to obscure the main issue, i.e. the lack of a humidity increase that is essential to the warmistas hypothesis about carbon dioxide-induced warming.
You have to go to the AMSU site and look that the temps. I cant post everything, Essentially they have not gone anywhere. Somehow I messed up and posted a reply to you on another site Junk Science has , so here it is:
BTW to see how temps have been cooling
http://models.weatherbell.com/climate/cfsr_t2m_recent.png
also the AMSU site will show the mid level temps have essentially been levels while RHS have fallen, even more starting since it means wet bulbs are falling. This is opposite the IPCC theory of trapping hot spots causing low level warmings, the hot spots because the air in the mid and upper levels is becoming more warm and moist creating the traps. I dont have time to show everything to folks, if I plant the seed, you have to go till the field to see if it has fruit
capice?
BTW you see what is going on here. They put out ideas, that grab headlines and we have to debunk them. So I have to “waste” time with chart after chart. Its actually a winning strategy, one advocated by Alinsky in Rules for Radicals, tie your opponents up with deceit, and all the while enact your agenda. I am convinced that there is no way to fight it. I have no illusions about how this will turn out. Because being right doesnt matter to them, they really dont care. You and I might, but they dont, And a public that hears every weather event now that they may not even have known about 20 or 50 years ago is the worse they have ever seen, fed by a media who I have to conclude has the same goals, simply marches along
You see my friend the issue is not about science. If it was, there is enough doubt for a civil debate that had nothing to do with the political and economic situation in this country. But there is the problem, This is not about science. Its about using science, or in this case a false perception, to gain control in other matters. Sorry, its the only conclusion. While it might be nice to occasionally be on TV cause my mom likes to see me, as a man of conscience I dont like seeing my nation handcuffed by policies from a forecast that has been busting for 17 years and as the PDO continues cold and the amo is goes cold, is likely to only get worse. Misery and hardship in what is supposed to be a free and competitive society where each person has a chance to excell and by doing so, enhances the social good, is not very progressive to me.
If you wish to read more, this is not the first time I have opined on this matter. There are a whole slew of my agw arguments here with charts galore
http://patriotpost.us/columnists/180
hope that helps
I wish Joe Bastardi had plotted dew point vs time rather than relative humidity vs time. His plot leaves open the argument, “The air is warmer so there is more absolute humidity now than there was earlier”. I do not believe that, the air is not that much warmer, but the dew point would have been more definitive.
Reblogged this on The Grey Enigma.
Yes, mb is the unit of pressure; here it corresponds to density altitude. This graph is missing the line for 1000 mb — relative humidity at surface level. It was probably omitted because it does not vary as much as it does at the higher levels of the atmosphere.
Here you will find another version of the same graph:
http://landshape.org/enm/greenhouse-thermodynamics-and-water-vapor/
How do I read this graph? Is it showing the relative humidity at different atmospheric pressure readings? Does mB = milli-bar? Also, why would the trend be for last 60 years show a lowering of global relative humidity in the atmosphere? I could understand regional variations in humidity but why would the average global humidity change?
I know. The extra water in the atmosphere is hiding in the deep ocean along with the missing heat. When the CO2 level gets high enough, it will all appear as if by magic. Then you will all be sorry. The conclusion is still the same, we must stop the future, stop using fossil fuels, stop technological civilization, and return to the state of the art during the middle of the dark ages or we are all doomed.
Or maybe not. Especially since there are myriad lines of evidence, physical laws, and laws of logic that says the above is nothing but a fear driven arbitrary word salad with no bases in reality. There is even less evidence in its favor than Chicken Little had to justify her claim “The Sky is falling.”
At least an acorn fell and hit Chicken Little’s head. She didn’t have to “adjust” the data, contort the charts, withhold the data and methods, and make unsubstantiated charges about the funding of her opponents. She simply misinterpreted the evidence she had and came to a faulty conclusion.
The public needs to be more broadly educated. Specialisation has developed to a point where everybody’s area of competence is vanishingly small. Common sense is no longer a useful notion, while trust is easy to exploit.
Intuitively, I wouldn’t buy the idea that “the atmosphere is now carrying more moisture”, but I wouldn’t know what the data looked like.
Should we not be looking at the historical population concentrations before we start looking a total damages incurred as a indicator of increase of intense storms? How can we say that 500 years ago was less active as there was less damage reported . . Again it appears to be observational phenomena being used to produce a false premise – at best a red herring.
Now they will say , it’s because there is less humidity???
But if it’s warmer, how can that be???
Nevermind..
Bill Price