Ten-nine-ignition-sequence-starts-six-five-four-three-two-one-lift-off-Joe-Romm-has-lift-off.
The Climate Progress view of reality:
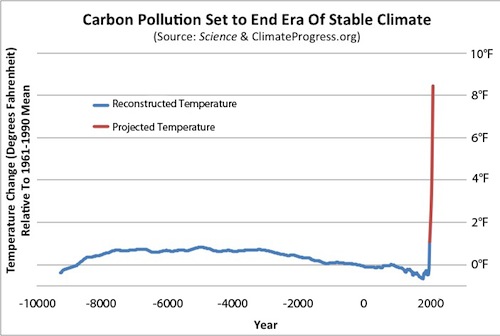
Here’s reality’s view of reality:

Ten-nine-ignition-sequence-starts-six-five-four-three-two-one-lift-off-Joe-Romm-has-lift-off.
The Climate Progress view of reality:
Here’s reality’s view of reality:
Is it really clear why “climate” as long term is easier to predict other than people see the errors in weather and hopefully will forget the predictions in climate before they arrive?
Sure, but he will just invent another factor to explain it. Remember, suddenly natural factors were really powerful when the temperatures flattened out. It’s easy to explain failed prediction when you can just amend the theory over and over.
Sort of looks like what I expect to happen in Richmond in the next few weeks. Other than seasonal warming, will anyone call him on the failed prediction because he is making the mistake of an alarmist projection in a timespan that can be checked?
the argument is that “weather” and “climate” are two different things. Okay. But so far they can’t reliably predict EITHER, and I’m supposed to bet the farm on it? yeah. sure. maybe next year.
Sunday, we had a giant dust storm (too much dust to see the neighbor’s house half a block away) followed by a raging blizzard for over an hour (about 3 inches of snow, wind from all directions). Further east, I25 was closed in the AM because the blowing dust was so bad there was zero visibility. The forecast was for warmer and sunny.
Two weeks ago, the weather service actually admitted they had no clue it would snow three or four inches on Monday. That was very unusual–no excuses, just a shrug and a “we don’t know”.
On the noon news yesterday, the forecast for here was PC and dry for the next several days. By sundown it was raining and snowing off and and has continued to do so today. They can’t predict the weather 7 hours ahead of time, but using the same data and technology they are going to accurately predict what the temperature will be to 0.01 degree C 100 years from now?
And they fly into a psychotic rage if anyone has the temerity to ask this question.
Back when science was actually taught in schools, there was grade that was always put on such work: F
Actually Scott, there is no way on any timescale to make a 0 increase appear vertical. Period. Nor is there any evidence that would suggest an 8C rise in temperature. That prediction borders somewhere between the ludicrously unlikely and outright impossible no matter what happens.
The lower graph is just seven thousanths of one of the 2000 year increments of the top graph so both graphs could be true but there is no reason to assume the top graph from the bottom one.
Alarmists have been trying to get it up forever, but it seems no amount of self massage or group massage is working. Why not prescribe free viagra for climate scientists and climate spongers, that would eradicate global warming panic overnight.
One has to wonder just what Old Joe’s been sniffing.