But it could be all about how the temp data is sliced.
The USDA says:
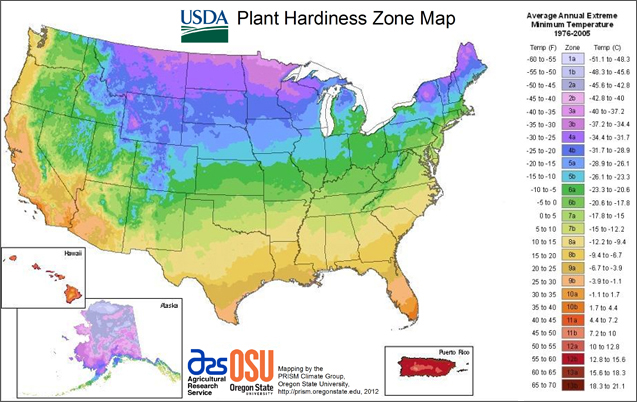
The new version of the map includes 13 zones, with the addition for the first time of zones 12 (50-60 degrees Fahrenheit) and 13 (60-70 degrees Fahrenheit). Each zone is a 10-degree Fahrenheit band, further divided into 5-degree Fahrenheit zones “A” and “B.”
To help develop the new map, USDA and OSU requested that horticultural and climatic experts review the zones in their geographic area, and trial versions of the new map were revised based on their expert input.
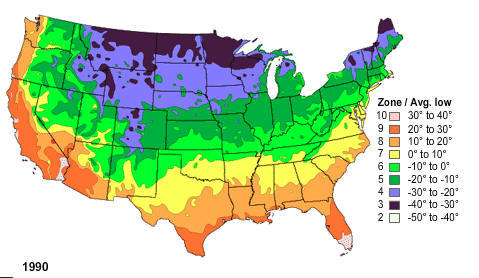
Compared to the 1990 version, zone boundaries in this edition of the map have shifted in many areas. The new map is generally one 5-degree Fahrenheit half-zone warmer than the previous map throughout much of the United States. This is mostly a result of using temperature data from a longer and more recent time period; the new map uses data measured at weather stations during the 30-year period 1976-2005. In contrast, the 1990 map was based on temperature data from only a 13-year period of 1974-1986.
Below is the new (2012) map.
Here’s the old (1990) map.


This enrages me, since we are, and always have been zone 5 here in lower Litchfield County, CT. They pushed us into Zone 6! If I plant a tree or plant that cannot survive Zone 5 here it WILL die over winter. This global climate warming junk is just idiotic. I feel bad for folks following these new maps that plant their trees, shrubs and flowers and then wonder why they keep dying over winter!!!
A key piece of information missing in the accompanying text, is that the 1960 map nearly matches the 2006 map. The odd map in the sequence is in fact, the 1990 map which covers the 1970’s and early 1980’s which were a cold period of the 20th century.
Anyone disbelieving this needs merely to “Google” the 1960 USDA map to see for himself. GW can now be tossed into the trash heap with Al Gore’s other claim of inventing the internet.
Steve K.
For the west coast, particularly California’s central valley, it doesn’t look like anything has changed.
Here in Montana, I used to see 40 below every winter. These days, we almost never see 20 below. New map looks accurate from here.
ditto, for michigan. The old zones are far more appropriate. Last winter we had a long bitter cold spell that fits nicely in the lower limit of the old maps. The new map may be ok this year which has been very mild, but not so much when our winter is somewhere in between these two extremes (ie: regresssion to the mean)
There is also a “user friendliness” aspect to this: 9 vs 26 zones.
The new map has Denver in 5b, -10 to -15. Well, it can still get down to -20 here or colder. I have some plants in my yard that are the old zone 5 and almost lost them many times, even though I have them in warmer microclimates like next to the house or in the southwest corner. Some have died back to the ground and started over from the root. My hydrangea still doesn’t bloom on old wood.
Less experienced or first-time gardeners will be sorry when they plant less hardy plants. In the Denver area, it’s best to stick to the old zone 4 or less and stick to plants that are related to a native plant.