NASA scientist James Hansen launched climate idiocy on June 23, 1988 with his famous Senate testimony. This review of it 35 years later indicates that Hansen’s testimony was largely just hot air, which no doubt contributed to the legendary stuffiness of the Senate hearing room that day.
Hansen’s verbatim oral testimony is presented below with claim-by-claim fact checks.
###
Hansen Testimony
Mr. Chairman and committee members, thank you for the opportunity to present the results of my research on the greenhouse effect which has been carried out with my colleagues at the NASA Goddard Institute for Space Studies.
I would like to draw three main conclusions. Number one, the earth is warmer in 1988 than at any time in the history of instrumental measurements.
Wrong again, Jim
We don’t know what the Earth’s temperature is today, let alone in 1988 or anytime earlier.
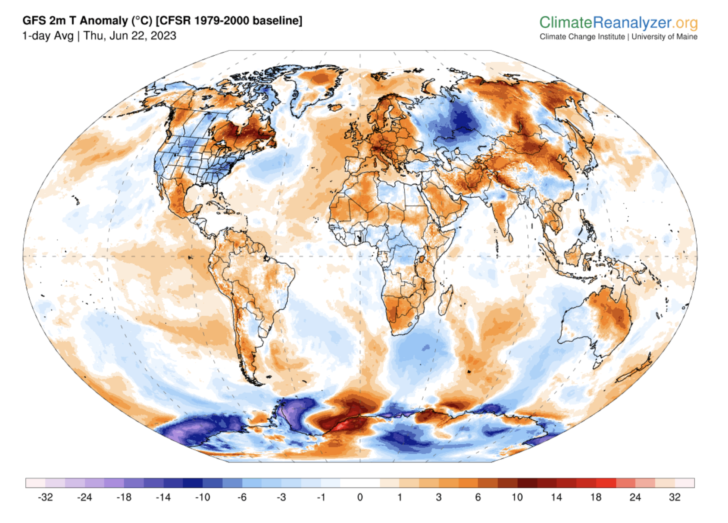
First, here is an image of how variable temperatures are around the world:
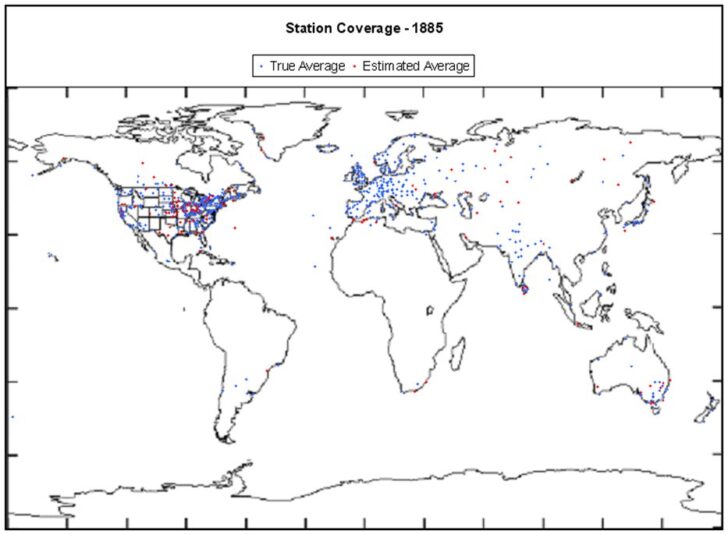
Here is an image showing the distribution of temperature stations circa 1885:
Here is an image showing the distribution of temperature stations as of 2022:
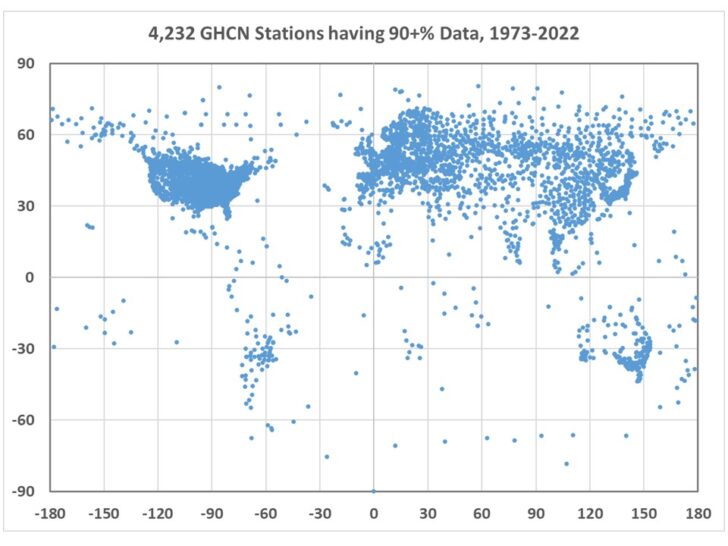
So even today, quite a bit of global temperature variability is missed by Hansen’s “instrumental measurements.”
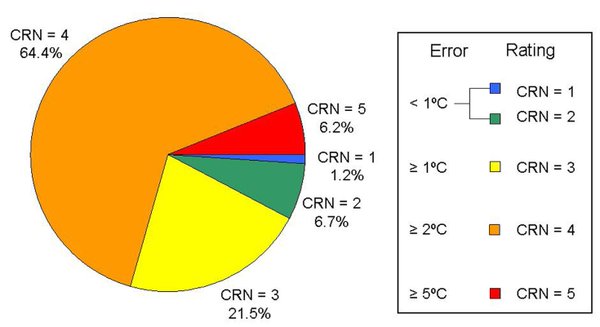
Also less than 8% of NOAA temperature stations reliably measure temperature to within 1°C.
Hansen Testimony
Number two, the global warming is now large enough that we can ascribe with a high degree of confidence a cause and effect relationship to the greenhouse effect.
Wrong again, Jim
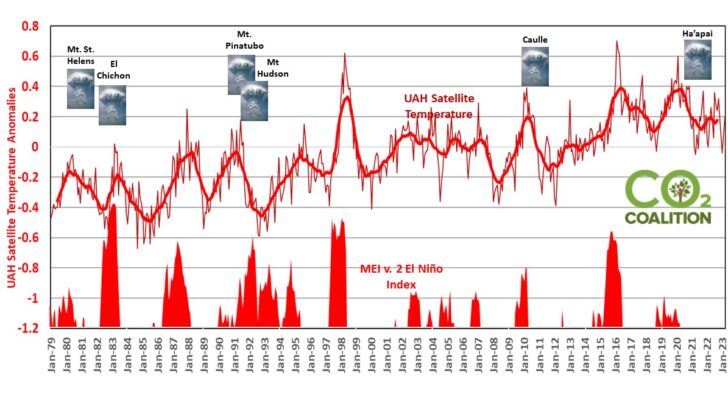
Hansen claimed that emissions were enhancing the greenhouse effect and warming the planet. But since Hansen’s 1988 testimony, it has become clear that El Ninos, not emissions have been driving warming. El Ninos put more water vapor (the dominant greenhouse gas) into the atmosphere, causing warming. There really is no evidence that manmade carbon dioxide (CO2) emissions have caused any warming.
Hansen Testimony
And number three, our computer climate simulations indicate that the greenhouse effect is already large enough to begin to effect the probability of extreme events such as summer heat waves.
Wrong again, Jim
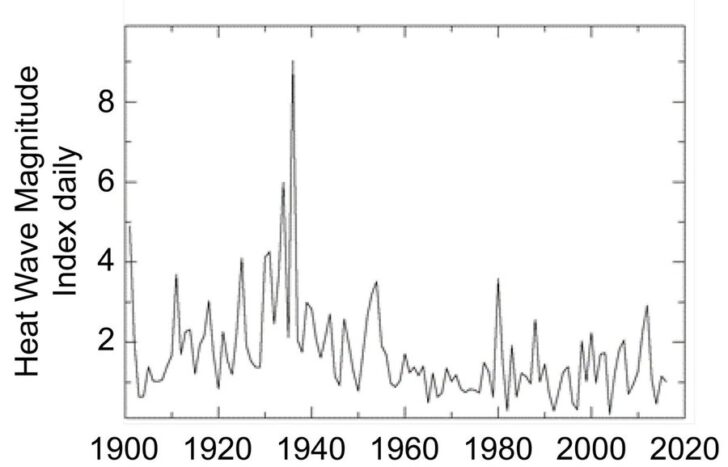
Emissions do not at all correlate with more or more intense heat waves, per the National Climate Assessment.
Hansen Testimony
My first viewgraph shows the global temperature over the period of instrumental records which is about 100 years. The present temperature is the highest in the period of record. The rate of warming in the past 25 years, as you can see on the right, is the highest on record. The four warmest years, as the Senator mentioned, have all been in the 1980s. And 1988 so far is so much warmer than 1987, that barring a remarkable and improbable cooling, 1988 will the warmest year on the record.
Wrong again, Jim
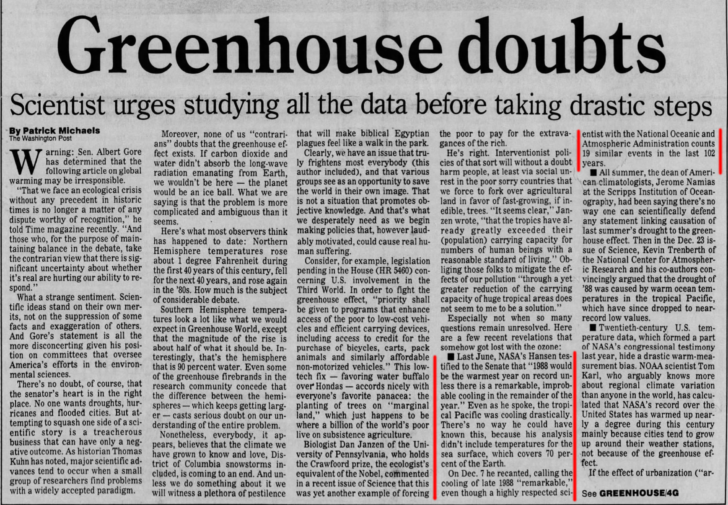
As pointed out by the late Pat Michaels in February 5, 1989 (less than 8 months after Hansen’s testimony), Hansen’s prediction that 1988 would be the warmest year on record, didn’t survive the year.
Hansen Testimony
Now let me turn to my second point which is causal association of the greenhouse effect and the global warming. Causal association requires first that the warming be larger than natural climate variability and, second that the magnitude and nature of the warming be consistent with the greenhouse mechanism. These points are both addressed in my second viewgraph. The observed warming during the past 30 years, which is the period when we have accurate measurements of atmospheric composition, is shown by the heavy black line in this graph. The warming is almost 0.4 degrees Centigrade by 1987 relative to climatology, which is defined as the 30-year mean, 1950 to 1980 and, in fact, the warming is more than 0.4 degrees Centigrade in 1988. The probability of a chance warming of that magnitude is about 1 percent. So with 99 percent confidence we can state that the warming during this time period is a real warming trend.
Wrong again, Jim
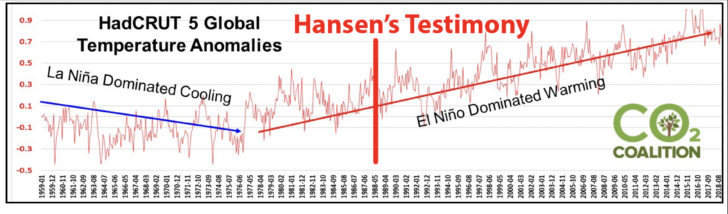
Hansens’s claim of a warmer world were made in a period of El Niño warming. It was warming. But the cause was El Niño, not emissions.
Hansen Testimony
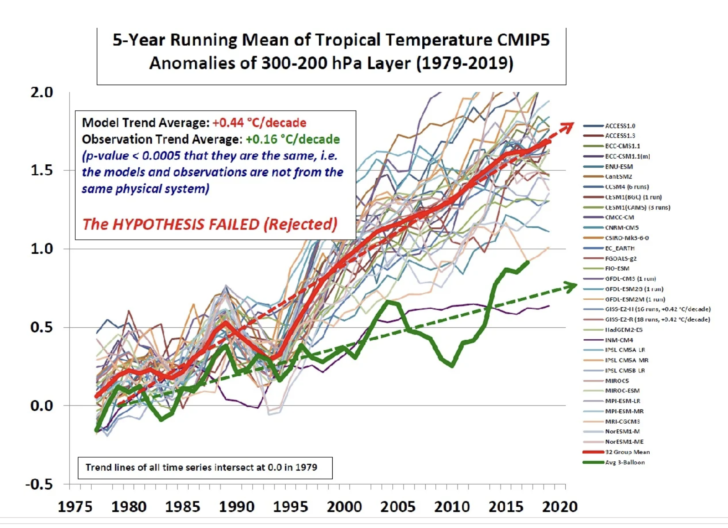
The other curves in this figure are the results of global climate model calculations for three scenarios of atmospheric trace gas growth. We have considered several scenarios because there are uncertainties in the exact trace gas growth in the past and especially in the future. We have considered cases ranging from business as usual, which is scenario A, to draconian emission cuts, scenario C, which would totally eliminate net trace gas growth by the year 2000. The main point to be made here is that the expected global warming is of the same magnitude as the observed warming. Since there is only a 1 percent chance of an accidental warming of this magnitude, the agreement with the expected greenhouse effect is of considerable significance.
Wrong again, Jim
Climate models have massively over-predicted warming (red line vs. green line, below).
Hansen Testimony
Moreover, if you look at the next level of detail in the global temperature change, there are clear signs of the greenhouse gas effect. Observational data suggests a cooling in the stratosphere while the ground is warming. The data suggest somewhat more warming over land and sea ice regions than over open ocean, more warming at high latitudes than at low latitudes, and more warming in the winter than in the summer. In all of these cases, the signal is at best just beginning to emerge, and we need more data. Some of these details, such as the northern hemisphere high latitude temperature trends, do not look exactly like the greenhouse effect, but that is expected. There are certainly other climate factors involved in addition to the greenhouse effect.
Wrong again, Jim
Stratospheric cooling is not necesarily a sign of greenhouse gas warming, per meteorologist Anthony Watts:
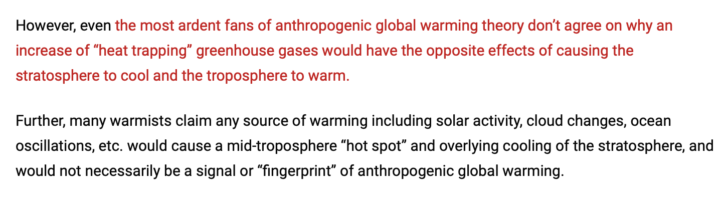
In any event, when Hansen talks about the “greenhouse has effect”, that would include the effect of water vapor, the dominant greenhouse gas. El Niño warming would increase atmospheric water vapor.
Hansen Testimony
Altogether the evidence that the earth is warming by an amount which is too large to be a chance fluctuation and the similarity of the warming to that expected from the greenhouse effect represents a very strong case. In my opinion, that the greenhouse effect has been detected, and it is changing our climate now.
Wrong again, Jim
To this day — and 35 years after Hansen’s testimony — it cannot be scientifically demonstrated that CO2 emissions have had any discernible effect on global climate. Moreover, if there has been any recent “climate change”, one would be hard pressed to find someone who can explain exactly what the change has been. We live in the same climate today as in 1988 and before. The weather is always different, but that by itself does not constitute “climate change.” As Hansen readily admits, his claims are all merely his opinion — not scientifically provable facts.
Hansen Testimony
Then my third point. Finally, I would like to address the question of whether the greenhouse effect is already large enough to affect the probability of extreme events, such as summer heat waves. As shown in my next viewgraph, we have used the temperature changes computed in our global climate model to estimate the impact of the greenhouse effect on the frequency of hot summers in Washington, D.C. and Omaha, Nebraska. A hot summer is defined as the hottest one-third of the summers in the 1950 to 1980 period, which is the period the Weather Bureau uses for defining climatology. So, in that period the probability of having a hot summer was 33 percent, but by the 1990s, you can see that the greenhouse effect has increased the probability of a hot summer to somewhere between 55 percent and 70 percent in Washington according to our climate model simulations. In the late 1980s, the probability of a hot summer would be somewhat less than that. You can interpolate to a value of something like 40 to 60 percent.
I believe that this change in the frequency of hot summers is large enough to be noticeable to the average person. So, we have already reached a point that the greenhouse effect is important. It may also have important implications other than for creature comforts.
My last viewgraph shows global maps of temperature anomalies for a particular month, July, for several different years between 1986 and 2029, as computed with our global climate model for the intermediate trace gas scenario B. As shown by the graphs on the left where yellow and red colors represent areas that are warmer than climatology and blue areas represent areas that are colder than climatology, at the present time in the 1980s the greenhouse warming is smaller than the natural variability of the local temperature. So, in any given month, there is almost as much area that is cooler than normal as there is warmer than normal. A few decades in the future, as shown on the right, it is warm almost everywhere.
Wrong again, Jim
So here’s a monthly map to consider. This is the US temperature map for June 1988 followed by the temperature map for June 2023.
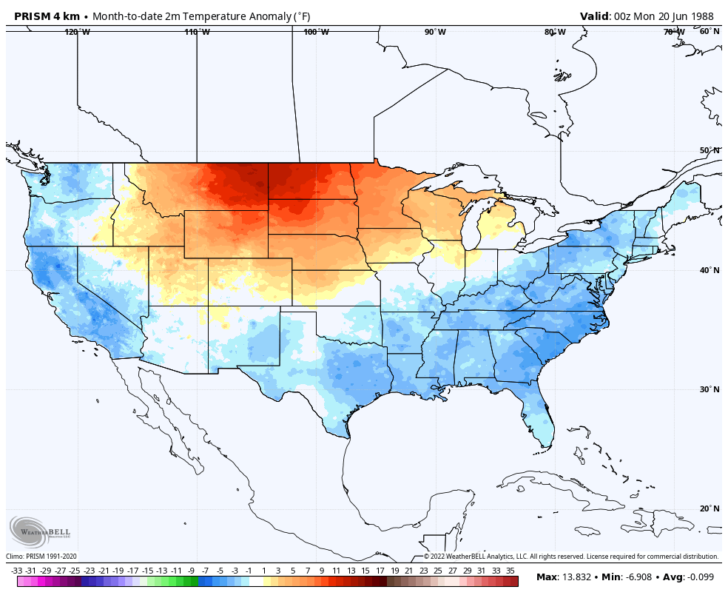
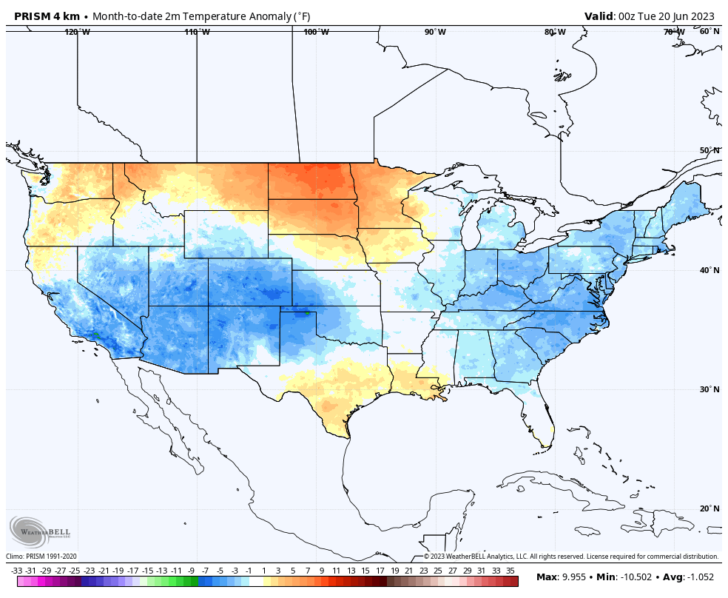
Despite all the CO2 emissions since June 1988, June 2023 is so far almost 1°F cooler than June 1988.
So “a few decades in the future”, it is NOT “warm almost everywhere.”
Hansen Testimony
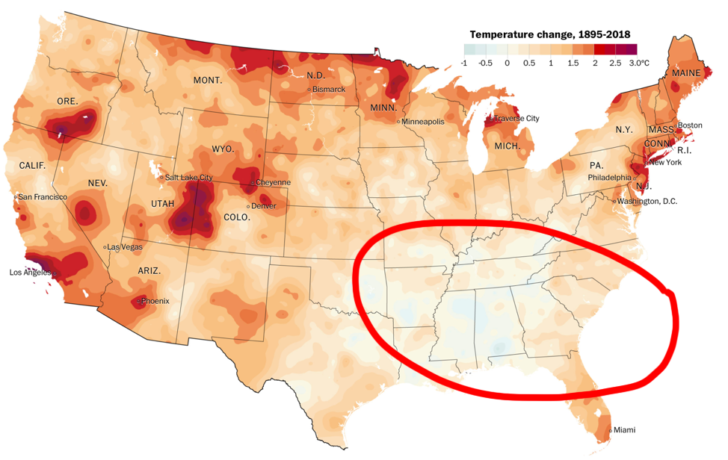
However, the point that I would like to make is that in the late 1980s and in the 1990s we notice a clear tendency in our model for greater than average warming in the southeast United States and the Midwest. In our model this result seems to arise because the Atlantic Ocean of the coast of the United States warms more slowly than the land. This leads to high pressure along the east coast and circulation of warm air north into the Midwest or southeast. There is only a tendency for this phenomenon. It is certainly not going to happen every, and climate models are certainly an imperfect tool at this time. However, we conclude that there is evidence that the greenhouse effect increases the likelihood of heat wave drought situations in the southeast and Midwest United States even though we cannot blame a specific drought on the greenhouse effect.
Therefore, I believe that it is not a good idea to use the period 1950 to 1980 for which climatology is normally defined as an indication of how frequently droughts will occur in the future. If our model is approximately correct, such situations may be more common in the next 10 to 15 years than they were in the period 1950 to 1980.
Wrong again, Jim
Below is a temperature map put together by the climate alarmist Washington Post. There is not really any warming occurring in the southeast US.
Hansen Testimony
Finally, I would like to stress that there is a need for improving these global climate models, and there is a need for global observations if we’re going to obtain a full understanding of these phenomena.
Right for once, Jim
35 years later, that is the only sentence that Hansen got correct.
Hansen Testimony
That concludes my statement, and I’d be glad to answer questions if you’d like.
###
If you haven’t had your fill of missed predictions by James Hansen, here are some more from RealClimateScience.com:
- More Massive Sea Level Fraud From James Hansen
- James Hansen – Celebrating 30 Years Of Total Incompetence
- NASA Climate Prophet James Hansen Says The Arctic Is Ice-Free
- James Hansen – Worst Scientist Who Ever Lived?
- Thirty Years Of The James Hansen Clown Show
- Another Massively Failed Forecast By James Hansen
- James Hansen 2008 : “This is the last chance.”
More in the Wrong Again series: