“The authors have falsified their research findings.”
June 29, 2017 NEJM article “Air Pollution and Mortality
in the Medicare Population”
By
James E. Enstrom, Ph.D., M.P.H.
jenstrom@ucla.edu
June 28, 2017
1. The authors have falsified existing research findings. Co-author Dominici failed to cite key findings from her own prior publication on this cohort: December 2008 EHP article “Mortality in the Medicare Population and Chronic Exposure to Fine Particulate Air Pollution in Urban Centers (2000–2005)” by Scott L. Zeger, Francesca Dominici, Aidan McDermott, and Jonathan M. Samet. Examples of falsification are described below.
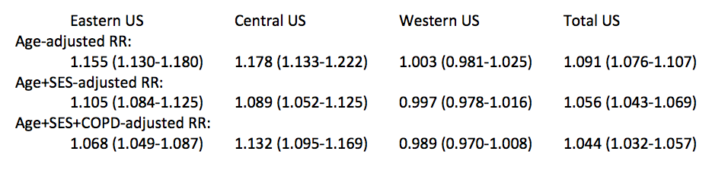
Table 3 of the EHP article shows large unexplained geographic variation in PM2.5 mortality risk in the Eastern, Central, and Western portions of the US and this variation is not addressed in the NEJM article. The total US age-adjusted RR was 1.091 (1.076-1.107), whereas the total US age-SES-COPD-adjusted RR was only 1.044 (1.032-1.057). The total US RR in the Medicare cohort may be NULL if it is fully and properly adjusted to account for sex, race, cigarette smoking, and education level. There was NO relationship in the Western US (mainly CA) in any case. These severe limitations on the Medicare findings must be fully acknowledged in the NEJM article.
The geographic variation in RR from the EHP Table 3 is shown below.
The authors failed to properly cite two major national cohorts which found NO relationship between PM2.5 and total mortality: Thurston 2016 and Enstrom 2017.
- April 2016 Thurston EHP article: 517,041 subjects in 6 states and 2 cities in NIH-AARP cohort found RR ~ 1.025 (1.000-1.049) during 2000-2009. Proper conclusion: NO PM2.5-total mortality relationship in US.
- March 2017 Enstrom Dose-Response article: 269,766 subjects in 85 Counties in ACS CPS II cohort reanalysis found RR = 1.023 (0.997-1049) during 1982-1988. Conclusion: NO PM2.5-total mortality relationship in US.
2. The authors have violated epidemiologic standards and limitations. Although this entire article involves air pollution epidemiology, none of the authors have any formal training in epidemiology, such as, a Ph.D. or M.P.H. in epidemiology. The Ph.D. degrees are in physics, statistics, and environmental chemistry. Also, only one author (Schwartz) is originally from the US. Three are from China, two are from Italy, one is from Greece, and one is from France. These facts are relevant because 1) this entire article ignores the standards and limitations of epidemiology, particularly the criteria necessary to establish a causal relationship and 2) the authors are clearly advocating for tighter pollution (PM2.5 and ozone) regulations in the US. They inserted advocacy sentences, such as, “In the entire Medicare population, there was significant evidence of adverse effects related to exposure to PM2.5 and ozone at concentrations below current national standards.” and “These findings suggest that lowering the annual NAAQS0 may produce important public health benefits . . . . “ Their press release is almost pure advocacy for tighter regulations.
The senior authors (Schwartz, Dominici, Zanobetti, and Koutrakis, in that order) are well aware that tighter regulations in the US are scientifically and socioeconomically unjustified and will harm primarily blue collar workers throughout the US, particularly in California and the Rust Belt. They further know that air pollution regulations are badly needed in other countries like China and India, not in the US.
3. US air is clean and safe. Evidence from new WHO Report that PM2.5 in the US is at record low levels (about 9 micrograms per cubic meter nationally) and that the US is one of the cleanest countries in the world cleanest countries in the world (http://www.breitbart.com/big-government/2017/06/05/who-united-states-among-least-polluting-nations-on-the-planet/). The focus on air pollution health effects and regulations needs to be in those counties where it is still a major problem, such as, China, India, and Africa. See WHO Map below for PM2.5. The air pollution in the US is now at healthy levels and must be put in context with other factors that affect our health and economics.
4. Contradictory studies ignored. NEJM Editor-in-Chief Jeffrey Drazan, who co-authored the alarmist NEJM editorial, “Air Pollution Still Kills,” has a strong, long-running bias in favor of positive PM2.5 and mortality studies and against NULL PM2.5 and mortality studies. This bias, dating back at least to 2004, is documented in Reference 27 of Enstrom’s Dose-Response article. Enstrom’s NULL 2005 and 2017 articles were rejected by NEJM, as were numerous letters criticizing NEJM articles on air pollution and mortality.
5. Free the data — no secret science. The authors must immediately make their underlying data, properly redacted, available for independent reanalysis. The authors received essentially all their funding from the US taxpayers via EPA, NIH, and HEI. Furthermore the Harvard TH Chan School of Public Health is well aware of the 2013 House Science Committee Subpoena, the 2014 and 2015 Secret Science Reform Acts, and the 2017 HONEST Act. Harvard authors must comply with the spirit of these Bills if they want to retain credibility.

Annual mean ambient PM2.5 (µg/m3). [Source: http://maps.who.int/airpollution/]
“The Ph.D. degrees are in physics, statistics, and environmental chemistry.”
I would trust those qualifications over Epidemiology myself
They only looked at all-cause mortality. Makes me wonder if they looked at respiratory mortality and cardiovascular mortality and didn’t find an association. They also didn’t say they excluded accidental deaths. Usually a study that excludes accidental deaths says they do. Also, an annual average of 50 ppb ozone is really high. Houston, TX has never monitored an average that high. Basically, they were comparing ozone associations in southern California to the rest of the US.
” if they want to retain credibility. …” seriously? credibility?
ha ha ha ha ha ha ha ha ha ha ha ha ha ha ha ha ha ha ha ha
In their own words…….
1. ‘In the eastern and central regions, a 10-μg/m3 increase in 6-year average of PM2.5 is associated with 6.8% [95% confidence interval (CI), 4.9–8.7%] and 13.2% (95% CI, 9.5–16.9) increases in mortality, respectively.’
What, if anything, does this mean?
2. ‘We found no evidence of an association in the western region or for persons ≥ 85 years of age.’
All you need for immunity from PM is to live in the west or attain the age of 85…………..
LOL
The item that came to my attention was the statement that blacks where 3 times more likely to die from FPM than whites. They couldnt explain it, they just said it happened. That should have brought the entire study into question. Without a logical medical reason why mortality from FPM was three times higher for blacks, it is extremely likely they were not measuring death from FPM, they were measuring some other mortality cause entirely.
This is the most damaging quote “Co-author Dominici failed to cite key findings from her own prior publication…”
It borders on unbelievable, and warrants a detailed rationale from the Co-author and the other co-authors, not to mention the Journal!
Do you have a link to the source?