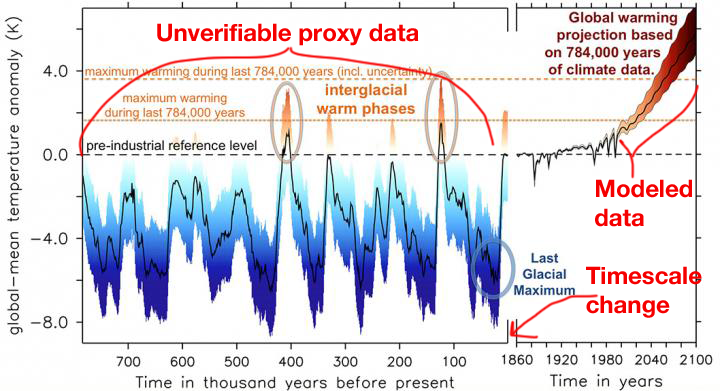
Nice graph. But can you see what’s wrong with it?
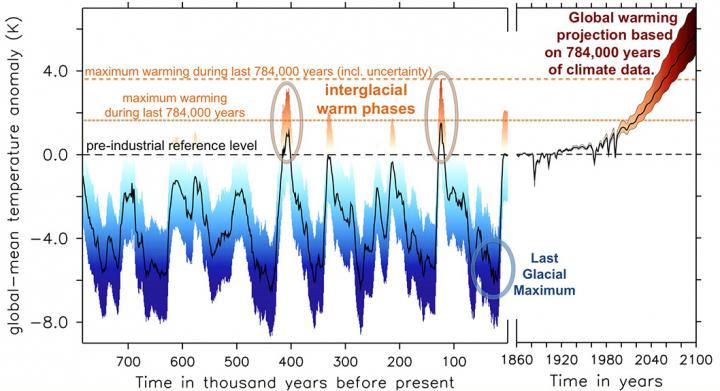
There’s no science, only distortion, in it.
Proxy data is not scientific because it cannot be verified. Modeled data is not scientific because it cannot be verified in our lifetimes. Misleading drama added to the graph by extending the present day time scale. Despite the foregoing, note that global temp is still trending lower even with today’s “hottest” temperature.
The media release is below.
A warm climate is more sensitive to changes in CO2
UNIVERSITY OF HAWAII AT MANOA
It is well-established in the scientific community that increases in atmospheric CO2 levels result in global warming, but the magnitude of the effect may vary depending on average global temperature. A new study, published this week in Science Advances and led by Tobias Friedrich from the International Pacific Research Center (IPRC) at the University of Hawai?i at Mānoa (UHM), concludes that warm climates are more sensitive to changes in CO2 levels than cold climates.
Increasing atmospheric CO2 concentrations cause an imbalance in the Earth’s heat budget: more heat is retained than expelled, which in turn generates global surface warming. Climate sensitivity is a term used to describe the amount of warming expected to result after an increase in the concentration of CO2. This number is traditionally calculated using complex computer models of the climate system, but despite decades of progress, the number is still subject to uncertainty.
The new study, which included scientists from the University of Washington, the University at Albany, and the Potsdam Institute for Climate Impact Research, took a different approach in calculating climate sensitivity: using data from the history of Earth. The researchers examined various reconstructions of past temperatures and CO2 levels to determine how the climate system has responded to previous changes in its energy balance.
“The first step was to reconstruct the history of global mean temperatures for the last 784,000 years, using combined data from marine sediment cores, ice cores, and computer simulations covering the last eight glacial cycles,” said Friedrich, a post-doctoral researcher at IPRC.
The second step involved calculating the Earth’s energy balance for this time period, using estimates of greenhouse gas concentrations extracted from air bubbles in ice cores, and incorporating astronomical factors, known as Milankovitch Cycles, that effect the planetary heat budget.
“Our results imply that the Earth’s sensitivity to variations in atmospheric CO2 increases as the climate warms,” explained Friedrich. “Currently, our planet is in a warm phase — an interglacial period — and the associated increased climate sensitivity needs to be taken into account for future projections of warming induced by human activities.”
Using these estimates based on Earth’s paleoclimate sensitivity, the authors computed the warming over the next 85 years that could result from a human-induced, business-as-usual greenhouse gas emission scenario. The researchers project that by the year 2100, global temperatures will rise 5.9°C (~10.5°F) above pre-industrial values. This magnitude of warming overlaps with the upper range of estimates presented by the Intergovernmental Panel on Climate Change (IPCC).
“Our study also allows us to put our 21st century temperatures into the context of Earth’s history. Paleoclimate data can actually teach us a lot about our future,” said Axel Timmermann, co-author of the study and professor at UHM.
The results of the study demonstrate that unabated human-induced greenhouse gas emissions are likely to push Earth’s climate out of the envelope of temperature conditions that have prevailed for the last 784,000 years.
“The only way out is to reduce greenhouse gas emissions as soon as possible,” concluded Friedrich.
###
First, all the “researchers” worked at universities or other leftist institutions which means they had to come up with this conclusion to keep the grant money flowing. Second, to change the scale on the graph like that is a favorite “statistical analysis” method to show more dramatic change. Third, CO2 levels are so high now that we should all be getting sun poisoning within 15 minutes of stepping outside but the temperatures don’t reflect that. Ever since the environmental wacko movement got started with Earth Day, Global Warming/ Climate Change, rising oceans, oil being a limited resource, etc. they have not predicted a SINGLE THING CORRECTLY. Their models are bogus. Garbage in = garbage out. The fact that college educated people fall for this drivel is mind boggling to me. I have several in my family. It is pathetic, as are these so-called researchers.
To me the graph looks extremely accurate. It even includes their projection based on Global Warming data. But it is the actual history that is more interesting.
The data being used to demonstrate a rise in temperatures since 1860 is corrupted by adjustments, UHI and the natural rise in the Earths temperature since coming out of the Little Ice Age. What portion may be due to CO2 is insignificant. Nothing to worry about here.
It has been established, and even the warmist admit that in previous interglacial periods the max CO2 lagged the max. temperature by 200 to 800 years. So what is going on?
And all they have done is beg the question – only if their assumption about the past is right can they be right about the future. But they have not provided any evidence whatsoever that their assumption about the past is right. If I make a totally different assumption about how CO2 has driven past temperatures, my prediction for the future will be totally different
As far as I can tell, they have used an assumption about the importance of CO2 in driving past temperatures that is hugely out of line with any other estimates.
So this is not just poor science (if it is science at all) but an obvious extreme case that is very unlikely.
I have constructed computer forecast models. Their validity is 100% defined first by the accuracy (with respect to the real world) of the formulas on which the model computations are based, and second by the validity of the data that is used to initiate the model’s forecast process. The process described here fails on both counts.
*that does not make
“Modeled data is not scientific because it cannot be verified in our lifetimes”
Also, If it turned out to be true, that could not verify a model. (If a gambler bets a team to win and they happen to win, that does make the gamblers model golden, the next game could go entirely differently.)
Maybe the reason the pollsters got it wrong is because they used these climate models to draw pretty lines predicting their preferred winner.
the magical year of 1860 (again). This is the worst sort of cherry picking in all their bent data presentations. 1860 is roughly the end of the Little Ice Age (LIA). So when you come out of an ice age it gets warmer. Duh. We are still not as warm as the Roman Warm Period nor as warm as the Middle Ages Warm Period. Yet here’s this graph shooting off the chart indicating the planet will catch on fire. Or something. I call BS on it.
One warm winter in the Northern Hemisphere will lower CO2 emissions far more than all of the hare brained schemes of the “climate change” crowd.