We have the graphs you decide.
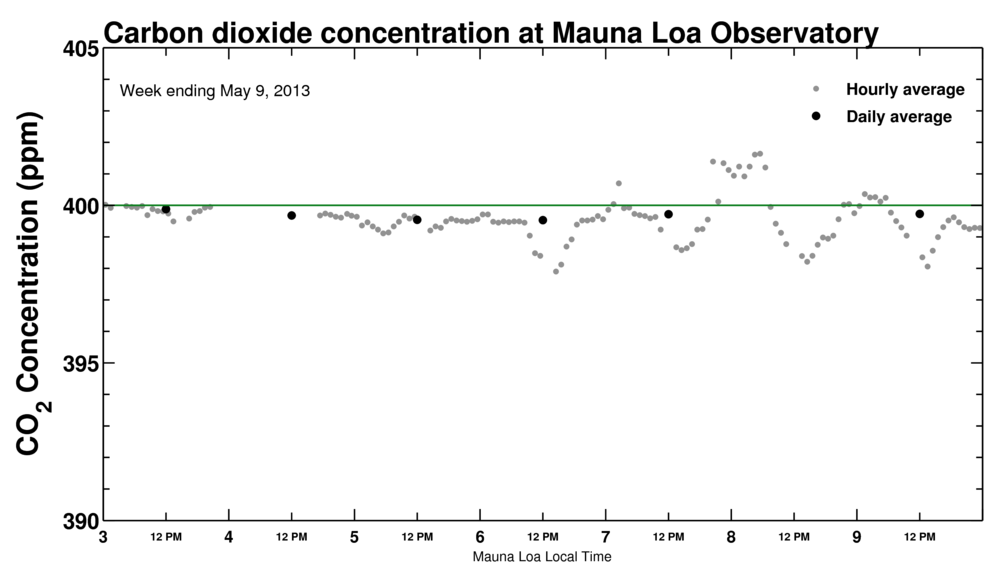
First, the Scripps graph for the past week:
Next from the NOAA article “How do scientists know that Mauna Loa’s volcanic emissions don’t affect the carbon dioxide data collected there?“:
Also in this Scripps article describing how it cheated to get the daily-average CO2 reading over 400 ppm, there was a graph showing the spiky nature of the 400ppm data — it has been deleted.
Dirq
Instead of believing them, then spreading their lies – get yourself a gadget that can tell you the amount of CO2 is in the air! You will discover this: in the city is more of it than outside b] during the day is LESS close to the ground, than at night c] before the rain is much more than after the rain BECAUSE: the good Lord made water to wash things, including CO2! The more of it is in the air -> the more of it gets washed by rain into the sea and into the soil – creates mineral / fizzy water.
such an important topic; not one ”Skeptic” has one of those gadgets…
your ” CO2 concentration map” is: shoveling the Warmist crap… have a nice day!.
Looks like several other sites besides mauna loa have consistent data.
http://scrippsco2.ucsd.edu/sites/default/files/graphics_gallery_images/co2_sta_records.png
@JMS – You don’t have to believe John Cook. Look at his sources and read it for yourself! Unless there’s also something wrong with the journal Nature that qualifies it to be summarily dismissed as well.
Peter –
Most of us that follow this issue know that Skeptical Science is not a reliable source of information.
As noted on WUWT
Unreliable*
■Skeptical Science – John Cook
* Due to (1) deletion, extension and amending of user comments, and (2) undated post-publication revisions of article contents after significant user commenting.
@Educate – Read this article for an explanation of the CO2 lag misconception: http://www.skepticalscience.com/co2-lags-temperature.htm. Despite the initial lag the Milankovitch cycle supports the idea that CO2 helps warm the planet. In that case the CO2 was produced by planetary out gassing resulting from an initial warming event. In the case of AGW we are supplying the CO2.
@paddylol – Read the link on why they believe their data (corrected for volcanism induced spikes) is accurate. Nevertheless, even if the Mauna Loa readings were flat out wrong because of contamination, that doesn’t nullify readings from the rest of the world. And it certainly doesn’t contradict AGW.
Come on, nobody cheated. UTC time is just as valid as local Hawaiian time on which to base the averaging interval. One could in fact argue that UTC time is a better standard, in which case not only did NOAA report 400.03 but Scripps would have reported 400.08–higher than NOAA! Regardless, everyone knows 400 ppm is a symbolic threshold like 10,000 was on the Dow Jones. In and of itself it means nothing. What is important is highlighting that the trend continues upward.
I have been questioning for years how the volcano outgassing effect from Mauna Loa and Kilauea can be separated from the ambient atmospheric CO2 when it is measured on Mauna Loa.
I suspect the true answer is that it can’t, making the reported atmospheric CO2 content reported is suspect.
Kilauea has been continuously erupting for about 35 years. Whenever the southerly Kona wind blows a condition Islanders call vog envelopes the west coast of the Big Island including Mauna Loa. Vog can smell bad, and if strong enough can make your eyes water and breathing problematic.
If the true CO2 measurements from Mauna Loa are overstated, the AGW theory can be flushed down the toilet.
Wrong on both 2 & 3. The Scripps instrument is located on Mauna Loa, not San Diego.
http://keelingcurve.ucsd.edu/instrument-status/
Local paper ran a two side by side articles on Saturday. One was about how the fishing opener was delayed on most of the lakes because they were still ice covered. The article right next to it was about the “scary” new high point of CO2 levels measured in the “pristine, clear air” of Mauna Loa. I found it humerous.
** 12 degree Celsius. the degree symbol did not display correctly.
The Role of CO2 in Global Warming
Global warming and CO2 levels have become a staple of the modern news media. The topic is both pervasive and contentions. Global air temperatures this century have been on the high end of the spectrum as have CO2 levels, but are these levels merely a coincidence, or is there a causal link? Much of the data presented by the mainstream media suggests that humans are causing global warming, but there is a growing body of evidence which suggest that the opposite is true.
According to CO2Now.org the current concentration of atmospheric CO2 is 389.35(CO2 Now, 2013). CO2 levels are indeed higher than they have been over the past 450,000 years, but they are no higher than they were 43 million years ago (Pearson & Palmer, 1999). The fact of the matter is that over a 420,000 years’ worth of 100,000 year glacial cycles, CO2 levels ranged between 180-290 ppm (Petit et al., 1999). Furthermore, the temperature range during this same time frame was 12o C which indicates that global temperatures are subject to dramatic changes without high levels of atmospheric CO2 (Petit et al., 1999).
Humans undoubtedly contribute to the CO2 levels in the atmosphere. Planetseed.com lists a few human sources of CO2. Among them are; the burning of fossil fuels, deforestation, and breathing. Burning fossil fuels is credited with releasing about 26 billion metric tons of CO2 into the atmosphere each year (Planetseed.com, 2013). Among the global warming crowd, the use of fossil fuel seems to be the major target for CO2 emission reduction. The problem with this goal is that there are no other viable and affordable alternatives to fossil fuel. Humans rely on fossil fuels as the energy source for all of today’s modern connivances and necessities. Fossil fuel use plays a role in heating homes, food production, and transportation. Without a viable alternative to fossil fuels, the reduction of their use will have to be forced upon mankind.
One of the major CO2 sinks on Earth rests in a plants ability to photosynthesize. Photosynthesis draws on energy from sunlight and uses it to convert carbon dioxide and water into carbon-based sugars such as glucose (Planetseed.com, 2013). Photosynthesis is responsible for nearly 50% of all CO2 sequestration (Planetseed.com, 2013). Deforestation eliminates a lot of carbon sequestering trees from the Earth, and slows the rate of CO2 extraction from the atmosphere. It is important that forests are harvested with conservation and replanting as part of the equation. In the meantime, scientists are currently experimenting with manmade synthetic chemicals that could extract CO2 from the air and excrete calcium carbonate (Webster, 2011). Sequestration technology combined with new viable energy sources could reduce CO2 concentrations without harming the less fortunate who cannot afford overpriced technology such as photovoltaic power.
I do not believe that humans are causing or even significantly contributing to global warming. From what I have read and from the statistics that I have seen, I cannot conclude that CO2is causing global warming. I am more convinced that global warming is causing CO2 levels to rise. During the last three glacial terminations, the Earth warmed long before there was any increase in the air’s CO2 content (Fischer, Wahlen, Smith, Mastroianni, & Deck, 1999). In order to prove causation, it must be clearly demonstrated that the cause precedes the effect. Based on Fischer et al., the cause is global warming and the effect is higher levels of CO2, not vice versa as manmade global warming propagandists would have you believe.
References
Carbon Dioxide Sources. PlanetSEED. (2013). Retrieved May 12, 2013, from http://www.planetseed.com/relatedarticle/carbon-dioxide-sources
Climate and atmospheric history of the past 420,000 years from the Vostok ice core, Antarctica. Nature 399: 429-436. concentrations. Science 284: 1824-1826.
CO2 Now (2013). Retrieved May 11, 2013, from http://co2now.org/
Fischer, H., Wahlen, M., Smith, J., Mastroianni, D. and Deck B. 1999. Ice core records of atmospheric CO2 around the last three glacial terminations. Science 283: 1712-1714.
Pearson, P.N. and Palmer, M.R. 1999. Middle Eocene seawater pH and atmospheric carbon dioxide
Petit, J.R., Jouzel, J., Raynaud, D., Barkov, N.I., Barnola, J.M., Basile, I., Bender, M., Chappellaz, J., Davis, M., Delaygue, G., Delmotte, M., Kotlyakov, V.M., Legrand, M., Lipenkov, V.Y., Lorius, C., Pepin, L., Ritz, C., Saltzman, E., and Stievenard, M. 1999.
Webster, G. (2011, October 14). “Living” buildings could inhale city carbon emissions – CNN.com. Retrieved May 12, 2013, from http://www.cnn.com/2011/10/14/tech/ innovation/living-buildings-carbon
Atmospheric CO2 has increased. So what?
#1 – not one org tracks the data,
#2 – NOAA = Mauna Loa, Hawaii noaa co2 data
Scripps = San Diego, CA, not near a volcano
http://keelingcurve.ucsd.edu/
#3 – even if you want to quibble or not about the actual number in both places it was darn near the same on opposite sides of an ocean, you cannot deny the trend line increase from the 19thC 280, to the 317 in the mid-20thC to approx. 400 now – what’s the common denominator fellas? hint: it’s not cow flatulance
If it were important.
Plimer, Heaven and Earth, pg 416ff, describes the measurement of CO2 on Mauna Loa. There are lots of difficulties including outgassing from volcano. Also Plimer wonders, does it make sense to have an important measurement in the hands of one organization?