The hockey stick is extended back 11,300 years. Now it looks likes a vacuum cleaner. Lame-o reconstruction is still junk science.
Compare the reconstruction…
With the profile of this…

The media release is below.
###
Reconstruction of Earth climate history shows significance of recent temperature rise
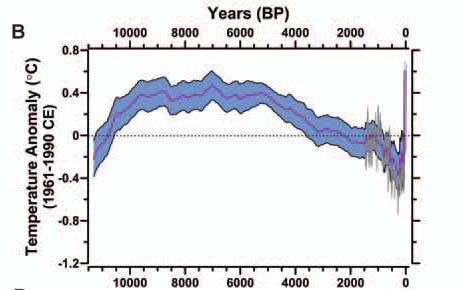
CORVALLIS, Ore. – Using data from 73 sites around the world, scientists have been able to reconstruct Earth’s temperature history back to the end of the last Ice Age, revealing that the planet today is warmer than it has been during 70 to 80 percent of the time over the last 11,300 years.
Of even more concern are projections of global temperature for the year 2100, when virtually every climate model evaluated by the Intergovernmental Panel on Climate Change (IPCC) shows that temperatures will exceed the warmest temperatures during that 11,300-year period known as the Holocene – under all plausible greenhouse gas emission scenarios.
Results of the study, by researchers at Oregon State University and Harvard University, were published this week in the journal Science. It was funded by the National Science Foundation’s Paleoclimate Program.
Lead author Shaun Marcott, a post-doctoral researcher in Oregon State’s College of Earth, Ocean, and Atmospheric Sciences, noted that previous research on past global temperature change has largely focused on the last 2,000 years. Extending the reconstruction of global temperatures back to the end of the last Ice Age puts today’s climate into a larger context.
“We already knew that on a global scale, Earth is warmer today than it was over much of the past 2,000 years,” Marcott said. “Now we know that it is warmer than most of the past 11,300 years. This is of particular interest because the Holocene spans the entire period of human civilization.”
Peter Clark, an OSU paleoclimatologist and co-author on the Science article, said many previous temperature reconstructions were regional in nature and were not placed in a global context. Marcott led the effort to combine data from 73 sites around the world, providing a much broader perspective.
“When you just look at one part of the world, the temperature history can be affected by regional climate processes like El Niño or monsoon variations,” noted Clark. “But when you combine the data from sites all around the world, you can average out those regional anomalies and get a clear sense of the Earth’s global temperature history.”
What that history shows, the researchers say, is that over the past 5,000 years, the Earth on average cooled about 1.3 degrees (Fahrenheit) – until the past 100 years, when it warmed ̴ 1.3 degrees (F). The largest changes were in the northern hemisphere, where there are more land masses and greater human populations.
Climate models project that global temperature will rise another 2.0 to 11.5 degrees (F) by the end of this century, largely dependent on the magnitude of carbon emissions. “What is most troubling,” Clark said, “is that this warming will be significantly greater than at any time during the past 11,300 years.”
Marcott said that one of the natural factors affecting global temperatures over the past 11,300 years is gradual change in the distribution of solar insolation associated with Earth’s position relative to the sun.
“During the warmest period of the Holocene, the Earth was positioned such that Northern Hemisphere summers warmed more,” Marcott said. “As the Earth’s orientation changed, Northern Hemisphere summers became cooler, and we should now be near the bottom of this long-term cooling trend – but obviously, we are not.”
Clark said that other studies, including those outlined in past IPCC reports, have attributed the warming of the planet over the past 50 years to anthropogenic, or human-caused activities – and not solar variability or other natural causes.
“The last century stands out as the anomaly in this record of global temperature since the end of the last ice age,” said Candace Major, program director in the National Science Foundation’s Division of Ocean Sciences, which co-funded the research with NSF’s Division of Atmospheric and Geospace Sciences. “This research shows that we’ve experienced almost the same range of temperature change since the beginning of the industrial revolution as over the previous 11,000 years of Earth history – but this change happened a lot more quickly.”
The research team, which included Jeremy Shakun of Harvard University and Alan Mix of Oregon State, primarily used fossils from ocean sediment cores and terrestrial archives to reconstruct the temperature history. The chemical and physical characteristics of the fossils – including the species as well as their chemical composition and isotopic ratios – provide reliable proxy records for past temperatures by calibrating them to modern temperature records.
Using data from 73 sites around the world allows a global picture of the Earth’s history and provides new context for climate change analysis.
“The Earth’s climate is complex and responds to multiple forcings, including CO2 and solar insolation,” Marcott said. “Both of those changed very slowly over the past 11,000 years. But in the last 100 years, the increase in CO2 through increased emissions from human activities has been significant. It is the only variable that can best explain the rapid increase in global temperatures.”
###
I learned at High School, that it is CO (carbon monoxide) and not CO2 (carbon dioxide) which is toxic. So why do the doomsayers keep attacking a gas, which is according to the U,.S. Supreme Court a harmless gas, which is vital to all life on earth? (http://opinion.financialpost.com/2011/06/23/lawrence-solomon-supreme-skeptics/
On a related note: I once visited a health website and went through their longevity tool. It said that if I lost ten pounds, I would probably live three weeks longer. I swear it really happened.
Howdy BofH
Of course you’re right, but the whole global warming business is based on working far right of the decimal point with data that should stop at the decimal point. This is even more true when talking about sea level, damages due to weather events, droughts, floods, etc. If the CAGW folks had to work within the limits of the data, they couldn’t work at all. And unemployment is already too high.
John, 70-80% is much more accurate. If you have only a single digit of certainty (which in my opinion is laughably precise), then you have to say 70-80%.
Would you trust a project proposal that said that the cost of building a power plant will be $1,251,765,321.23? No, you’d call them an idiot for counting pennies on a number that is unlikely to be within a hundred million dollars.
Same thing.
Even if all of their “facts” are true, they continue to exhibit an inherent sloppiness and lack of care. For example:
“today is warmer than it has been during 70 to 80 percent of the time over the last 11,300 years”
If they are scientists and have all the exact facts, why not 72.33% or 78.777%–instead of 70 – 80%, which sound like my betting the odds on a football game. (or a % that most weather forecasters would love to achieve))
Given that they apparently know Pharoh’s global temperature better than we know last week’s global temperature, I’d say that they need lessons on error calculation.
The press release says that the temperature reconstruction is reliable, so I don’t know where you science-lovers get off pointing out all the tricks. The fact that they cherry-picked data, used an unreliable proxy, and mixed that unreliable temperature proxy data with instrument measurements which have been “adjusted” beyond all recognition shouldn’t matter. Now that everybody is in agreement, can we get on with destroying the world’s economies?
So, even if you take it at face value, it looks like global temps are just returning to “earth normal”. Isn’t that what the warmists want? Aren’t they saying that there is a “correct” earth temperature? Looks like we’re way below the norm right now. Got some warming to do boys, so roll up your sleeves!
Also, I’d like to be enlightened as to why those temps were so high without man spewing out CO2 and then why did they drop? Once the warmists can explain these things in current AWG terms, I’ll give them a little more credence.
BTW, Mann’s original “hockey stick” timeframe (back 1000 years) on this chart looks a lot more like a backwards “checkmark” to me (all downhill, then sharply up, as opposed to all flat, then sharply up). Makes current warming look more like a “recovery” than an abherration. Does this also mean that the warmists now quietly admit the hockey stick was bogus?
Whew! I thought the current warm spell was some sort of “abnormal aberration,” a “one off” that meant we had to be the cause and that there was no “precedent in history” for the current warmth! Luckily, these guys proved that it’s happened 20 to 30 percent of the time since the last ice-age.
Does anyone know where the “proxies” end and the “instrument records” have been grafted onto the end of the chart?
you’re Bit out of date, grapes are now being grown as far north as Perthshire, vineyards in England & Wales are not uncommon (about 400 commercial vineyards) & there are at least 20 vineyards in Denmark (developed since 1999) producing around 40,000 bottles of wine per annum
So this must mean we can onec again grow grapes in England and farm in Greenland.
The depth of these warmists’ arrogance and culpable ignorance of facts is truly breathtaking, but hardly surprising given the multibillion dollar scam industry, not to mention mass political and scientific reputations resting on keeping this Global Swindle alive. It’s going to get very ugly.
Once again, they managed to get rid of the Younger Dryas, a 1,300 long cold snap right after the last ice age ended. What is it with these guys and their models? Cheers –
Well, 73 is a lot. It’s much more then 13 or 47. So there.
A whole 73 sites eh?
The cherry picking ought to be a little better than that.
Desperate is an understatement. When does AR5 get published so we all can have a good laugh?