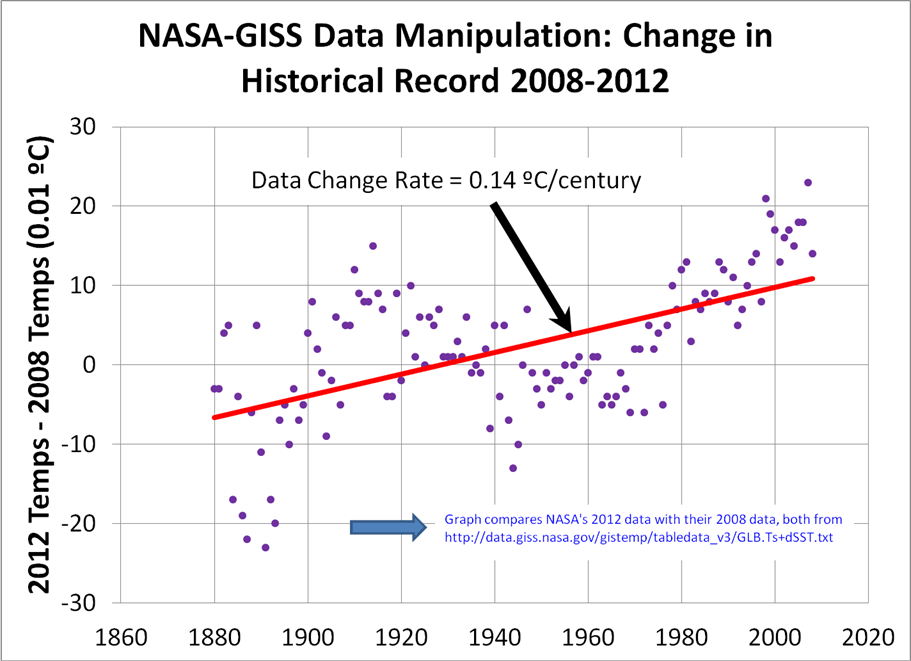
Has physicist Howard Hayden caught James Hansen et al. with their hands in the data manipulation jar?
Below is Hayden’s analysis.
###
In 2008 I downloaded a file of historical temperature data from http://data.giss.nasa.gov/gistemp/tabledata_v3/GLB.Ts+dSST.txt.
Today I downloaded the file from exactly that place, looking to put four more points onto a graph. WHOA! The temperatures were different.
Well, maybe they just used a different reference period, so I plotted the difference in (alleged) temperatures, namely the 2012 values minus the 2008 values (both in units of hundredths of a degree Celsius.
Hmm. The difference is increasing in time at the rate of 0.14 ºC per century, and there is considerable scatter. See graph below. (Were there merely a change in reference period, the light would be horizontal and have no scatter.) Evidently, NASA-GISS is massaging data to increase perceived “global warming.”
Does anybody have any idea what James Hansen’s Useful Idiots are doing, and why? Any idea why the file does not acknowledge the change?
Update from Howard Hayden:
I made an error in my previous posting. NASA-GISS did make some minor modifications to the temperature record, but nothing significant. But let me explain, using a few lines from a Dr. Seuss story called “Too Many Daves:
Did I ever tell you that Mrs. McCave
Had twenty-three sons and she named them all Dave?
Well, she did. And that wasn’t a smart thing to do.
You see, when she wants one and calls out, “Yoo-Hoo!
Come into the house, Dave!” she doesn’t get one.
All twenty-three Daves of hers come on the run!
You see, NASA-GISS uses a data file with one name to hold various kinds of data at various times. Specifically, that filename is
http://data.giss.nasa.gov/gistemp/tabledata/GLB.Ts+dSST.txt
In 2009, when I downloaded the file, the first heading and first data line read
Year Jan Feb Mar Apr May Jun Jul Aug Sep Oct Nov Dec J-D D-N DJF MAM JJA SON Year
1880 -22 -22 -24 -25 -30 -39 -20 -18 -20 -27 -30 -20 -25**** ***** -26 -26 -26 1880
Earlier in 2012 the lines were
Year Jan Feb Mar Apr May Jun Jul Aug Sep Oct Nov Dec J-D D-N DJF MAM JJA SON Year
1880,-56,-27,-34,-49,-22,-36,-23,26,-27,-43,-23,-20,-28,****,*****,-35,-11,-31,1880
On 8 Mar 2012, the lines were
Year Jan Feb Mar Apr May Jun Jul Aug Sep Oct Nov Dec J-D D-N DJF MAM JJA SON Year
1880 -43 -27 -25 -36 -31 -38 -23 -13 -29 -23 -19 -22 -28**** ***** -31 -25 -24 1880
I completely understand why NASA-GISS used the same filename for so many things. There are only so many ways you can arrange 59 characters, and they ran out of names. Possibly, they forgot about using Dave.
The long and short of it is that the file I downloaded earlier in the year was not for year-round average temperature, but was instead for meteorological stations only, whereas the 2009 file and the 8 Mar 2012 file were for land/ocean temperature. So the graph I sent is simply wrong; it specifically does not represent a manipulation of data.

Nero fiddled as Rome burned…
If this is true, then that would be legally actionable. Falsification of government records. But like Scooter Libby and the classified docs down the pants, I suspect little will come of it.
The New Zealand temperature record recently was found to be so completely fiddled with that they discarded the data. Problem is, that left them with no data at all. This isn’t the first fiddling, and won’t be the last.
Could you please make a graph with the two different sets of data as provided (not the difference)?